You’ve just been handed a topographic survey map. It’s a large-format CAD drawing, dense with lines, numbers, and symbols. and your architect is asking whether the drainage strategy works with the existing levels. Or your planning consultant needs to know the finished floor level relative to the flood zone. Or your civil engineer wants to confirm the proposed access gradient before the transport statement goes in.
These are real decisions, with real consequences, and they all depend on reading that drawing correctly.
The good news is that once you understand the logic of a topographic survey map, it’s genuinely not that difficult. This guide walks through everything you need to know: what the different elements mean, how to interpret contours with confidence, and what to actually focus on when you’re reviewing a survey deliverable for a live project.
What Is a Topographic Map?
Before going further, it’s worth being clear about something that confuses a surprising number of people, including experienced practitioners: “topographic map” means two distinct things in the UK, and conflating them causes unnecessary confusion.
Ordnance Survey Maps vs Commissioned Topographic Surveys
An Ordnance Survey (OS) map, the kind you’d buy for walking in the Peaks or use on a planning application for context, is a national mapping product produced at small scales (typically 1:25,000 for OS Explorer, or 1:50,000 for OS Landranger). It’s useful for orientation and context, but it’s a generalised product. The contours are at 10-metre intervals. The feature data is updated on national cycles, not on demand. And crucially, it doesn’t have the accuracy or detail needed for any serious design or planning work.
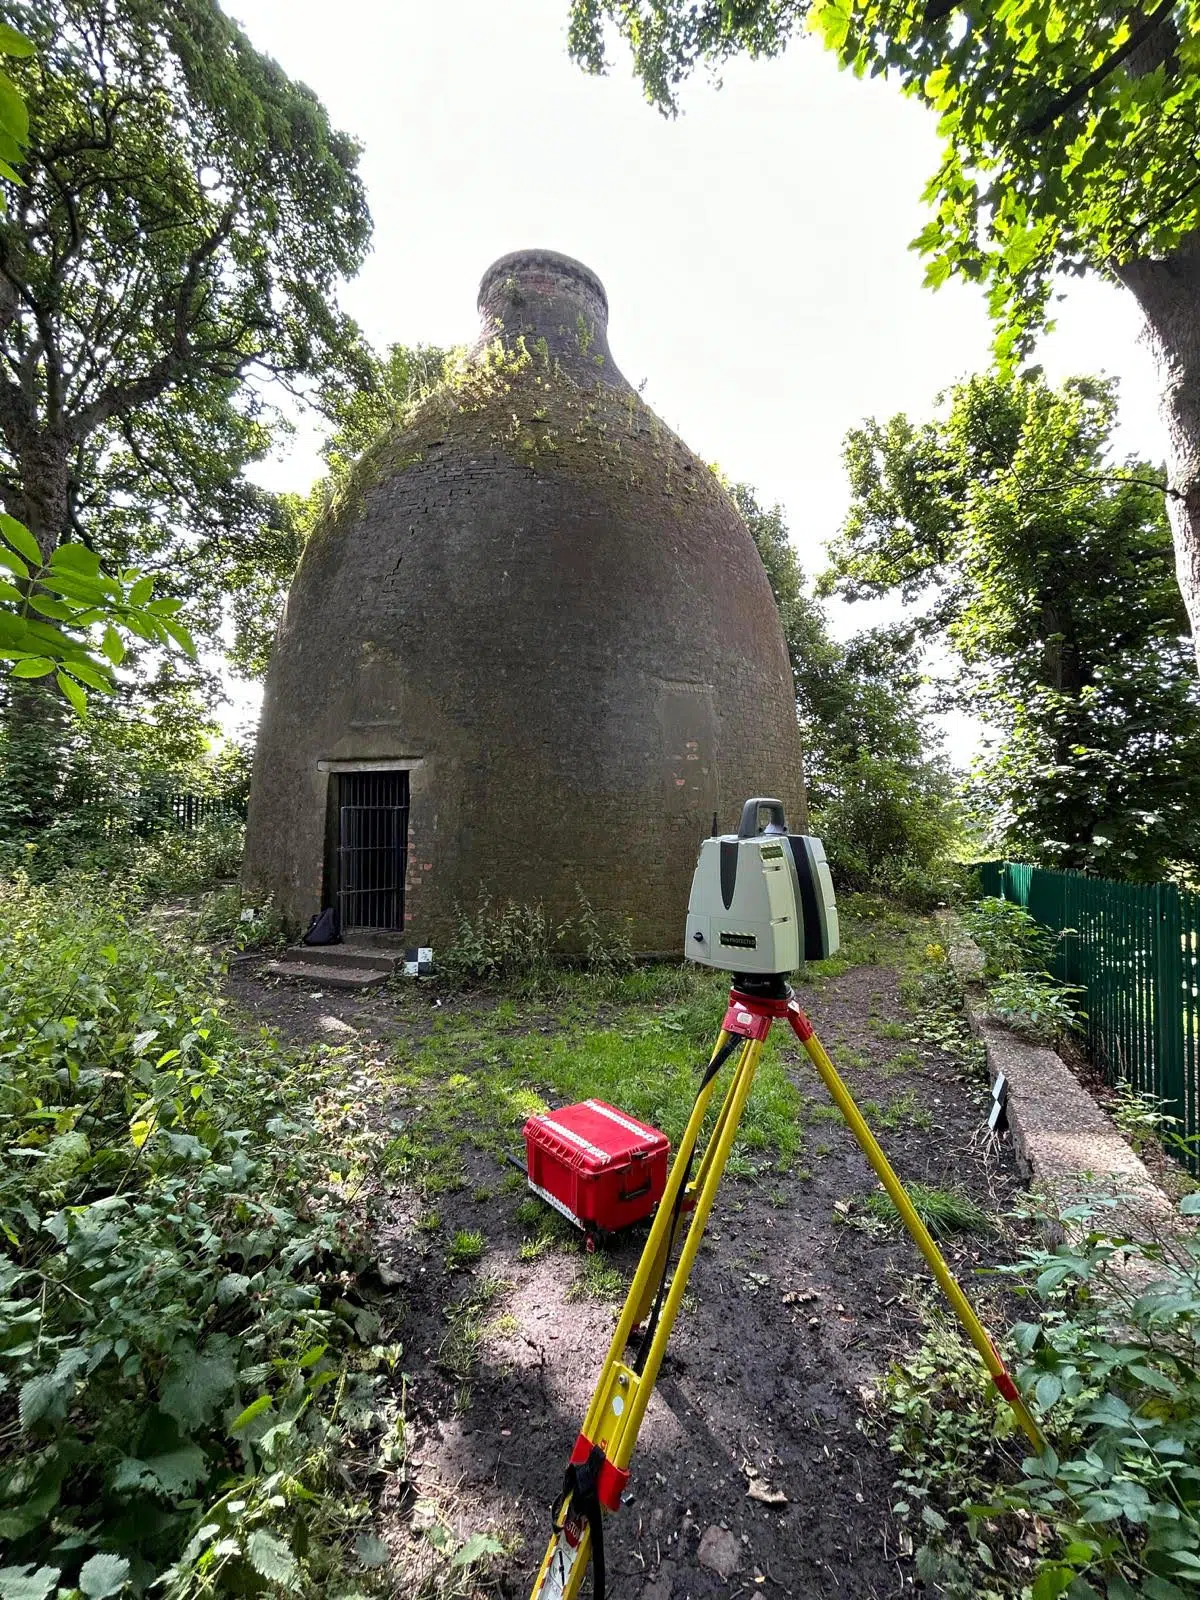
A commissioned topographic survey map, the deliverable you receive from a firm like Castle Surveys, is an entirely different document. It’s produced specifically for your site, at scales typically ranging from 1:200 to 1:500 (or tighter, for complex sites). The data is captured to RICS accuracy standards using total stations, GNSS receivers, or UAV and drone survey methods for larger sites. Every feature, level, and contour is surveyed specifically for your project, not interpolated from a national dataset.
When architects and engineers talk about a topographic survey, they mean the second type. This guide focuses entirely on that.
Why Topographic Maps Matter on UK Projects
For architects and planning consultants, a topographic survey map is typically the first piece of site-specific data that arrives on a project. It underpins the feasibility assessment, informs the initial design layout, supports the drainage and flood risk strategy, and forms a required drawing within most planning applications.
Without it, design decisions are made on assumptions. And in construction, assumptions have a habit of becoming expensive problems.
The Core Elements of a Topographic Survey Map
Title Block, Scale and North Arrow
Every professional survey drawing carries a title block, usually in the lower-right corner, containing the project name, site address, drawing number, revision status, date of survey, scale, and the surveying firm’s details. Before you read anything else on the drawing, check this first. The survey date matters; a topographic survey from three years ago may not reflect the current site condition if works have taken place since.
The scale tells you how distances on the drawing relate to distances on the ground. A scale of 1:500 means one millimetre on paper equals 500 millimetres (half a metre) on site. For detailed design work, 1:200 is more typical. For large sites or planning context drawings, 1:500 or 1:1000 may be appropriate. If the scale isn’t what you specified, query it before the drawing goes to the design team.
The north arrow orients the drawing. On professional survey drawings, this is usually grid north (aligned to the Ordnance Survey National Grid) rather than magnetic north, which is what matters for CAD and GIS workflows.
The Legend and Symbol Key
Unlike OS maps, which use a standardised national symbol set, professional survey deliverables use a project-specific legend. The symbols vary between firms and between projects, so don’t assume you know what a symbol means without checking the legend first.
Common symbols you’ll encounter include trees (shown with a circle and trunk point, often with the crown spread radius noted), manholes and inspection chambers (shown as squares or circles with an invert level and cover level), gullies, kerb lines, fence lines, walls, gate positions, and overhead or underground service indicators where these have been captured.
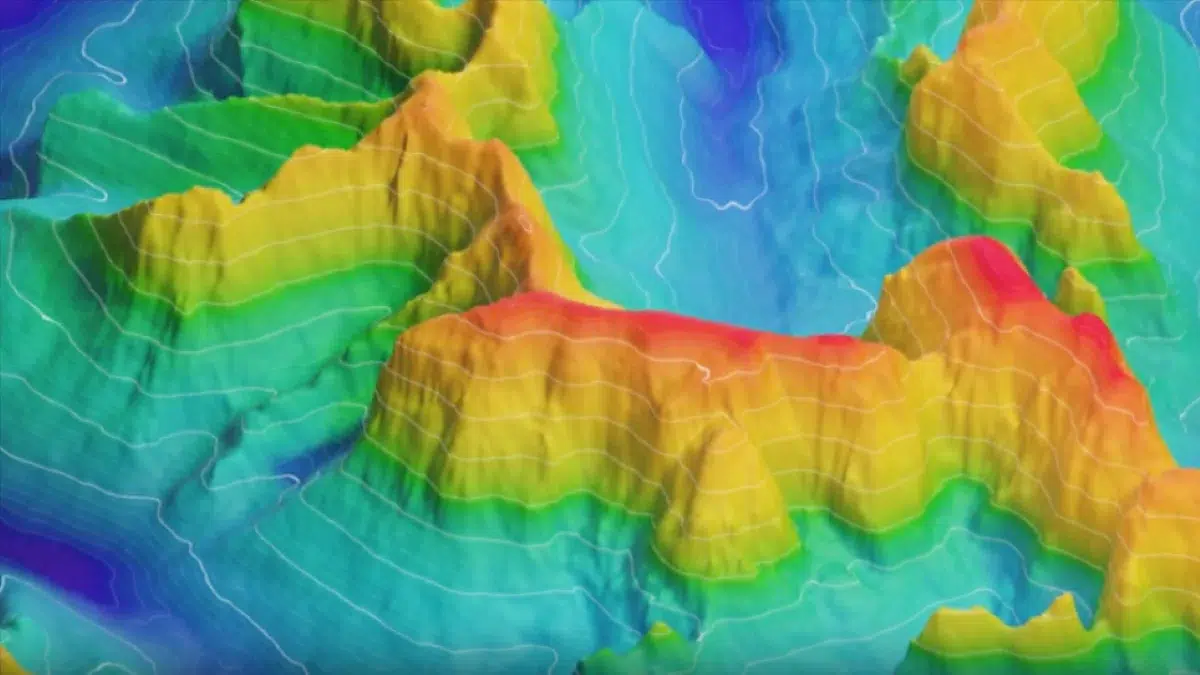
Contour Lines and Contour Intervals
Contours are the curved lines that represent points of equal elevation across the site. Every point on a given contour line sits at the same height above the survey datum. The vertical gap between adjacent contour lines is the contour interval, and it’s usually noted in the drawing notes or title block.
On professional UK topographic surveys, contour intervals are typically 0.25 metres, 0.5 metres, or 1 metre, depending on the scale and the relief of the site. The tighter the interval, the more granular the picture of surface shape you get.
Every fifth contour is usually drawn as an index contour, slightly thicker and labelled with its elevation value. These act as reference anchors when you’re counting up or down between labelled lines.
Spot Levels and Benchmarks
Spot levels, sometimes called spot heights, are precise individual elevation readings taken at specific points across the site. They’re shown as a cross or dot symbol with the level value annotated alongside, typically to two or three decimal places (e.g., 47.23m AOD).
Surveyors place spot levels at the most decision-relevant locations: manhole cover levels, threshold levels at building entrances, kerb and carriageway levels at access points, ridge and valley points on existing roofs, and at regular grid intervals across the site. These are often more useful than contours for specific engineering decisions, because they’re precise point readings rather than interpolated lines.
Temporary Bench Marks (TBMs) may also appear on the drawing. These are fixed reference points established by the surveyor on site, typically on stable structures like boundary walls or lamp post bases, and are used to re-establish the survey datum if additional visits are needed.
AOD and Site Datum Explained
AOD stands for Above Ordnance Datum, the UK’s national height reference system referenced to mean sea level at Newlyn in Cornwall. When a survey is carried out to AOD, all levels on the drawing relate to this national standard, which means they can be cross-referenced against Environment Agency flood maps, Ordnance Survey data, and any other nationally referenced dataset.
This matters enormously for planning submissions. A planning application for a site within or adjacent to a flood zone will require finished floor levels to be expressed in AOD so they can be assessed against the relevant flood level thresholds.
Some surveys, particularly for simpler projects, use an assumed or site datum, where the surveyor assigns an arbitrary starting value (often 100.00m) to a fixed point on site, and all other levels are relative to that. Assumed datum surveys are quicker and cheaper to produce, but they cannot be directly cross-referenced against flood maps or neighbouring surveys unless a conversion factor is established. If your project involves flood risk, drainage modelling, or interface with other surveys, always specify AOD.
How to Read Contour Lines on a Topographic Map
Steep Slopes vs Gentle Slopes
The spacing between contour lines is your primary visual indicator of gradient. Contour lines that are closely packed together represent a steep slope; the elevation is changing rapidly over a short horizontal distance. Lines that are widely spaced represent a gentle, gradual gradient.
This is immediately useful for access design: if the contours across your proposed vehicle entrance are closely spaced, you may have a gradient problem before any levels have been formally calculated.
Valleys, Ridges and the V-Shape Rule
When contour lines form V-shapes or U-shapes, they’re indicating either a valley or a ridge. The direction the V points tells you which: V-shapes pointing uphill (towards higher contour values) indicate a valley or watercourse; V-shapes pointing downhill indicate a spur or ridge.
This is particularly useful for surface water drainage strategy. A valley feature on the survey drawing is almost always where surface water naturally collects and flows, which has direct implications for the SuDS strategy, soakaway positioning, and culvert locations.
Summits, Depressions and Closed Contours
When contour lines form a closed loop with no other contours inside it, you’re either looking at a high point (a summit or mound) or a depression (a hollow or pond). The two look identical on a basic contour drawing, which is why surveyors use hachure marks, short tick marks pointing inward, to distinguish depressions. If the closed contours have hachures, it’s a hollow. If not, it’s a high point.
How to Read a Topographic Survey on a Live Project
What to Check First
When a topographic survey lands in your inbox, resist the urge to jump straight to the site area. Start with the title block. Confirm the survey date, the drawing scale, the datum used (AOD or assumed), the surveyor’s revision note, and any caveats or survey exclusions called out in the drawing notes. These will often tell you immediately whether the drawing is fit for purpose for your current stage of work.
Reading Levels for Drainage and Falls
One of the most common practical uses of topographic survey data is surface water drainage. To understand how the water will flow across the site, identify the lowest spot levels and the direction of the contours falling into them. The gradient between any two spot levels is easy to calculate: divide the difference in elevation by the horizontal distance between them.
A fall of 1:80 or steeper is generally required for surface water drainage. If the survey shows very flat terrain with limited natural fall, that’s a material constraint for the drainage engineer that needs to be flagged early.
What a Topographic Survey Can and Cannot Tell You
A topographic survey is a powerful document, but it has defined limits. It maps what is visible above ground at the time of survey. It does not confirm legal ownership boundaries; for those, you need Land Registry compliant plans prepared to the Land Registry’s specific requirements. It does not identify underground utilities; PAS128 utility mapping is a separate commission for that purpose. And it reflects site conditions as they were on the day of survey, not before or after.
For complex sites, 3D laser scanning can be combined with the topographic survey to produce a seamless point cloud dataset, capturing both the above-ground topography and the detailed geometry of existing structures in a single coordinated dataset.
A Quick Checklist for Reviewing Your Topographic Survey
Before the drawing goes to the design team, work through this:
Confirm the scale and datum match what was specified in the brief.
Check the survey extent covers your full project boundary, including any access routes or drainage outfall areas.
Verify that all required features have been captured: trees with crown spreads, manholes with cover and invert levels, threshold levels at all building entrances, kerb levels at the site access.
Cross-check spot levels at your proposed building footprint corners and access points.
Identify any “not surveyed” or “beyond survey extent” annotations and establish whether those areas affect your design.
Check the survey date and confirm whether any site changes since then need to be verified.
Query anything that looks inconsistent or unclear with your surveyor before issuing to the design team.
Confidence Comes from the Right Survey, Not Just the Right Map
Interpreting a topographic survey correctly is only half the equation. The other half is making sure the survey itself was carried out to the right standard, at the right scale, with the right features captured, and to the right datum for your project.
A survey brief that’s too vague tends to produce a drawing that leaves gaps; gaps that show up as queries during planning, surprises during design, or problems on site. Getting the specification right from the outset, including scale, datum, contour interval, feature list, and survey extent, is something we help clients work through before fieldwork begins.
Castle Surveys provides topographic surveys across the UK, with offices in England and Wales. For expert advice visit our topographic survey services page.
What scale should a UK topographic survey be drawn at?
It depends on the project stage and what the drawing will be used for. For planning applications and early feasibility, 1:500 is typically sufficient. For detailed design, including drainage, foundation layout, and setting out, 1:200 is more appropriate. On constrained or complex sites, 1:100 may be specified. If in doubt, discuss with your surveyor and your architect or engineer before commissioning, as rescaling from a lower-resolution survey later is not always straightforward.
What is the difference between AOD and site datum?
AOD (Above Ordnance Datum) is the national height reference system, tied to mean sea level at Newlyn, Cornwall. Any level expressed in AOD can be cross-referenced against national datasets, including Environment Agency flood maps and Ordnance Survey products. A site datum, or assumed datum, is a locally defined reference point with an arbitrary starting value (often 100.000m). It’s useful for straightforward projects where national cross-referencing isn’t needed, but it creates complications if the survey needs to interface with flood risk data, drainage models, or surveys carried out by other parties. For most planning submissions, AOD is the appropriate choice.
Can a topographic survey show legal boundaries?
No. A topographic survey records physical features on the ground, including fences, walls, and hedges that may or may not coincide with legal property boundaries. It does not confirm legal ownership extents. For that, you needLand Registry compliant plans prepared to the Land Registry’s specific requirements. Confusing the two is a common source of problems in conveyancing and planning, and it’s worth being clear about which document serves which purpose from the outset.
How often should a topographic survey be updated?
A topographic survey reflects the site as it was on the day of survey. If significant changes have occurred since then, whether through demolition, new construction, vegetation removal, or earthworks, the survey may no longer accurately represent existing conditions. As a general guide, a survey more than 18 to 24 months old should be reviewed carefully before being relied upon for detailed design or a planning submission. For contract handover or construction phase use, a more recent survey is almost always worthwhile.

Comments are closed here.